
Business leaders looking to make data-driven decisions often grapple with understanding the distinction between data analytics and business intelligence. Though the terms are sometimes used interchangeably, there are key differences that set these two practices apart. Digging deeper into these contrasts sheds light on the unique value proposition each offers.
This article will delve into the ins and outs of each, spelling out how they diverge in terms of their focus, goals, and use of data. We’ll cut to the core of data analytics as a forward-looking approach centered on statistical analysis and modeling for pattern finding. On the flip side, we’ll flesh out how business intelligence hinges on collecting, curating, and visualizing data to assess current performance.
The distillation of key takeaways will equip you to determine which capability set aligns better with different business objectives. Let’s jump right in and start dissecting the differences side by side to chart a clearer path forward.
- What is Business Intelligence?
- What are the different types of Business Intelligence?
- What is Data Analytics?
- What are the different types of data analytics?
- FAQs
- Q1: What is the main difference between Data Analytics and Business Intelligence?
- Q2: How does the purpose of Data Analytics differ from Business Intelligence?
- Q3: What tools are commonly used in Business Intelligence?
- Q4: What types of tools are used in Data Analytics?
- Q5: Can Business Intelligence and Data Analytics be used together?
- Q6: What skills are required for a career in Business Intelligence?
- Q7: What skills are necessary for Data Analytics?
- Q8: Is Business Intelligence more about descriptive analytics?
- Q9: Does Data Analytics involve more predictive and prescriptive analysis?
- Q10: What is the role of a Business Intelligence Analyst?
- Q11: What is the role of a Data Analyst?
- Q12: How do the goals of Business Intelligence and Data Analytics align with business strategy?
What is Business Intelligence?
Business intelligence (BI) refers to the processes, tools, and techniques focused on collecting, organizing, analyzing, and providing access to data to help enterprise users make better business decisions. BI centers around gaining actionable insights into business performance by condensing large volumes of data into digestible, easy-to-understand visualizations and reports.
At its core, BI zooms in on historical data regarding a company’s operations and performance metrics. It digs back into what has already transpired across key areas like sales, marketing, finance, human resources, production, and more. BI platforms pull massive amounts of structured data from sources such as CRM systems, ERP systems, web analytics, and financial reporting software. Skilled BI analysts pour through this vast data trove to filter out noise and focus on what matters most to various stakeholders.
These specialists leverage BI dashboards, performance scorecards, and advanced reporting functionality to piece together visual snapshots of a business’ health and results over weekly, monthly, quarterly, or annual periods.
BI paints a rearview mirror perspective of what has already come to pass to enable data-backed evaluations of organizational efficiency, profitability, comparisons across time periods, drilling down into problem areas, and tracking progress on objectives. These insights prime leadership teams to course correct on underperformance, double down on success drivers, and benchmark against industry peers. BI essentially centers on monitoring by turning data from the past into fuel for future enhancements.
What are the different types of Business Intelligence?
Traditional and modern business intelligence represent two pivotal eras in the ongoing evolution of data-driven decision-making. Let’s dive deeper into the key traits separating old school from cutting-edge BI, along with combining strengths:
Traditional BI
Traditional BI has deeply entrenched roots as the OG approach to analytics relies on structured, uniformly formatted data flowing mainly from long-established business systems like ERP, CRM, supply chain, and more. Traditional BI hinges on extracting data from these governed platforms to load into proprietary data warehouses, forming well-organized and sorted data sets.
Skilled data warehousing teams apply meticulous data modeling, mapping, and ETL (extract, transform load) processes to shape, cleanse, and consolidate data pulled from myriad sources into consistent schemas optimized for reporting. SQL programming and OLAP (online analytical processing) cubes help filter and slice data attributes to parse trends and patterns within these long relied-upon data troves.
Legacy reporting and dashboard tools visualize this neatly prepped data to help organizations monitor progress on KPIs, gauge performance vs targets over time, inform historical comparisons, keep tabs on operational health, and so much more. The mix of batched data, SQL metrics, canned reports, and a high bar for skills cements traditional BI’s role as a dependable workhorse.
Modern BI
Meanwhile, modern BI tools have percolated, taking advantage of ubiquitous cloud computing power and a Cambrian explosion of new-age data streaming in from websites, mobile, IoT sensors, and expanded third-party sources. Modern solutions enable customizable dashboards connecting far-flung data that blend traditional structured information with emerging unstructured outside feeds spanning contexts like weather, geotagging, social conversations, microtransactions, and more.
With rising data volumes from myriad origins, manual coding gives way to smart ML-powered automation that can rapidly ETL process, join, clean, and model context-aware pictures no human could paint before. Natural language and interactive visualization allow everyday business analysts to query trends on the fly vs coding from scratch or submitting requests to IT pros. Embedded machine learning helps automatically surface pertinent insights both on request and push vital alerts that keep decision-makers tapped in.
Thus, modern BI builds on traditional BI’s foundation of trusted, managed reporting, adding real-time accessibility, nimble exploration, and automation. Blending old and new creates an end-to-end analytics ecosystem harnessing the best of cutting-edge while ensuring governance. This allows organizations to mine intelligence from the past and present to chart emerging opportunities.
What is Data Analytics?
Data analytics encompasses more forward-looking techniques focused on statistical analysis, quantitative modeling, predictive analytics, and optimization to unearth hidden insights that drive significant business value. While BI reveals what happened, data analytics propels organizations to ask what could happen next and why in order to sharpen planning and decision-making.
Data analysts tap into the scientific method to form and test hypotheses around why certain business outcomes may be occurring. They sift through both structured and unstructured data from not only internal systems but external sources too – think market trends, customer sentiment analysis, economic projections, competitor intel, channel partner data, and more.
These talented number crunchers employ sophisticated statistical and modeling approaches like regression analysis, machine learning algorithms, multivariable testing, and optimization models to unlock powerful visibility into performance drivers, forecast future scenarios, preempt challenges, and project the implications of potential courses of action.
The fruits of data analytics fuel everything from predicting customer churn risk, shaping targeting marketing campaigns, simulating different resource allocation models, calculating the ROI of initiatives, and much more.
While BI monitors the past, data analytics consults emerging trends and patterns to discern opportunities to actively advance the business into the future. It centers on discovery by converting raw data into launching pads for strategic commercial growth and competitive differentiation.
What are the different types of data analytics?
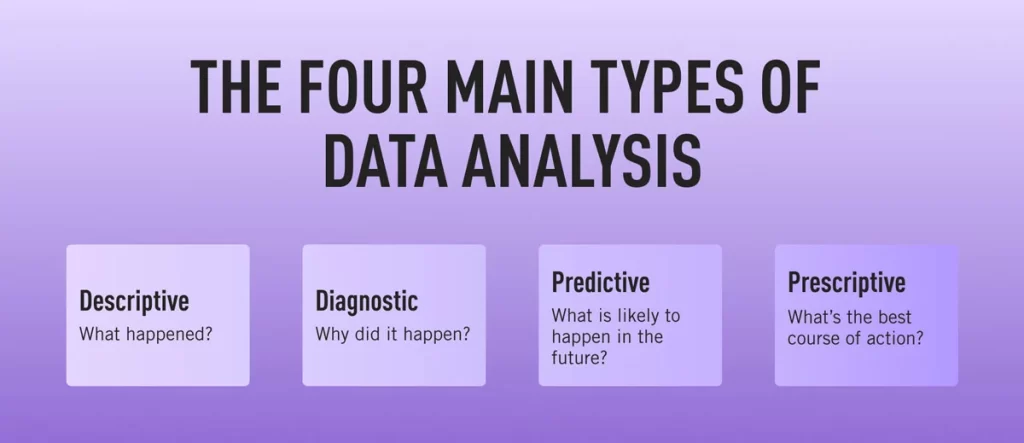
The field of data analytics can be broken down into four main types that each serve a distinct purpose. Let’s dig deeper into what differentiates descriptive, diagnostic, predictive, and prescriptive analytics.
Descriptive Analytics
Descriptive analytics focuses purely on shedding light on what has already transpired. It entails poring over historical data sets to quantify past performance, unearth trends and patterns, benchmark metrics against industry standards, and flesh out an unambiguous picture of the events, customers, revenue streams, costs, operational statistics, and more that have materialized up to the present point in time.
Descriptive methods like data mining, dashboards, reporting, and visualization tools springboard off asking targeted questions about the past. They elucidate what has occurred, where anomalies have cropped up, and begin tracing the trajectory of metrics over time to spot warning signs of dips or spikes. The insights derived prime organizations to make educated assessments of current health, progress towards KPI targets, and compare performance across business segments.
Diagnostic Analytics
While descriptive analytics scans the past, diagnostic analysis picks up where it leaves off, aiming to dissect the drivers and causal factors behind observed events. Skilled data scientists leverage statistical modeling, segmentation, hypothesis testing, and other empirical techniques to sift through volumes of granular data, isolating correlations and proving causation.
This brand of analytics drills down asking why – why have sales plunged in a certain region, why does one customer segment have higher turnover than another, why are production costs spiking? The deeper dip into diagnosing the root causes then provides a grounded basis to shape initiatives to course-correct problems or optimize processes. It permits a much sharper allocation of resources tackling issues backed by evidence vs hunches.
Predictive Analytics
Predictive analysis extrapolates from emerging patterns in the data, leveraging advanced analytics modeling, machine learning, and AI to gaze ahead rather than behind. It focuses inquiry on what new events or scenarios could plausibly manifest next backed by rational quantitative forecasts. Predictive modeling harnesses techniques like multivariate regression, neural networks, scenario analysis, and risk assessments.
By pinpointing what future outcomes hold the highest probability to transpire, organizations can then strategize preemptive moves to exploit the upside or mitigate downsides. Predictive insights empower organizations to sharpen planning across the board – from supply chain contingency plans to targeting marketing outreach, optimizing hiring, or hedging market risks. Rather than merely tracking history, it aims to write the next chapters ahead of time.
Prescriptive Analytics
Lastly, prescriptive analysis rounds out the data analytics value chain by pointing explicitly toward concrete actions to achieve strategic aims. It combines the fruits of what transpired historically, why, and what’s predicted next to conduct detailed simulation modeling of various decision pathways. Prescriptive methods weigh the implications of one choice vs another related to resource allocation, process flows, investment prioritization, and more to quantify the precise trade-offs involved in informing optimization.
This emerging apex of data analytics intends to cut out the guesswork for leadership, shining irrefutable light on what levers to pull, where to direct funds, how to configure operations, and so on to realize breakthrough business returns tailor-aligned to overarching goals. It transforms insight into strategy and action in one fell swoop.
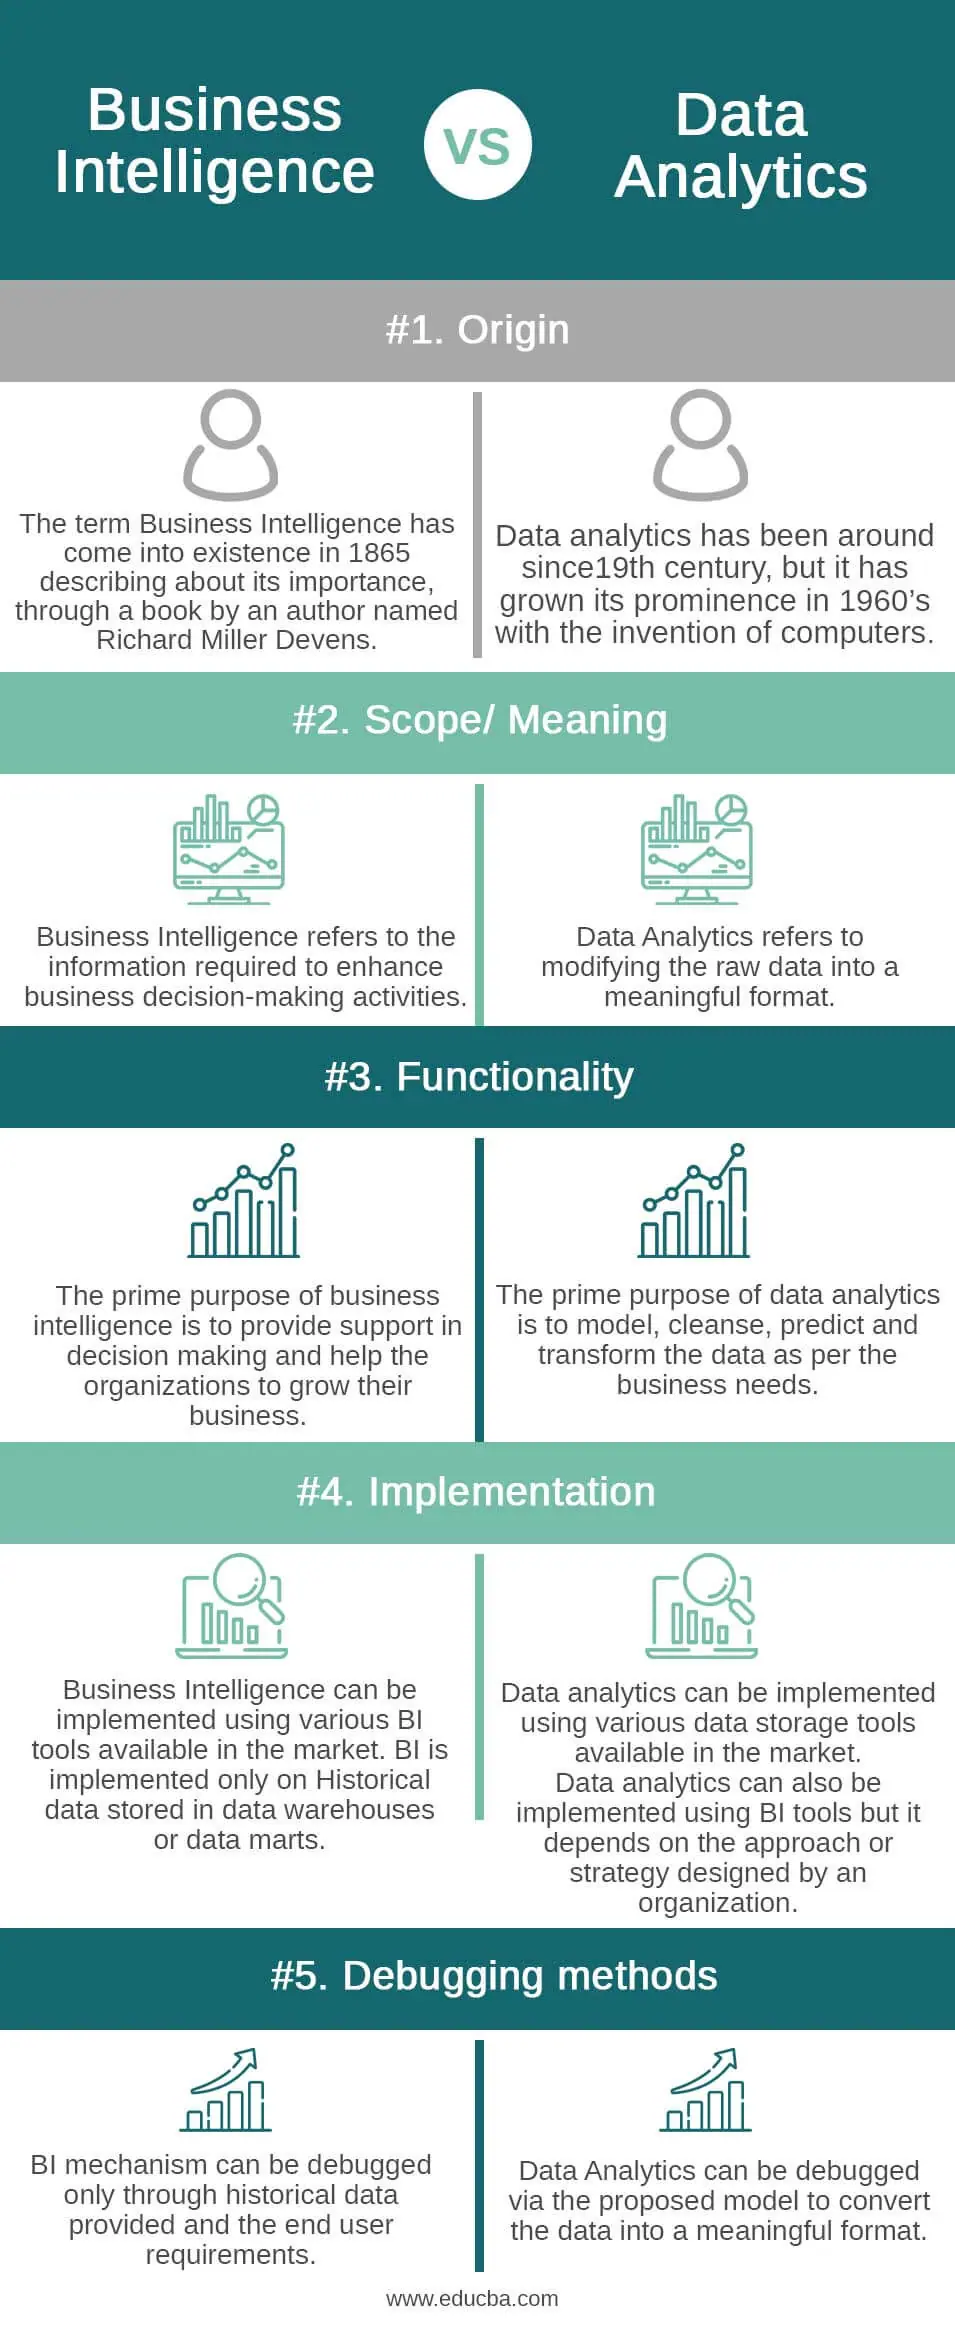
Differences Between Data Analytics and Business Intelligence
Here is a comparison of some key differences between data analytics and business intelligence:
Orientation
Business intelligence (BI) fundamentally gazes backward at past events and performance, tracking the rearview mirror snapshot. Data analytics predominantly orients forward, deploying advanced quantitative modeling to lock in what’s emerging ahead of the curve.
Data Sources
BI tools drill down into structured internal data of uniform formats, not straying much beyond data from organizational systems, ERP suites, CRM data warehouses, etc. Data analytics dives into wider, even unstructured data encompassing feeds from IoT sensors along with third-party and open-source data.
Outputs & Focus
BI crystalizes data into static reports, and visual dashboards, shedding light on KPIs, metrics monitoring, and benchmarking at a point in time. Data analytics forges fluid, interactive tools capable of forming and testing hypotheses about why trends surface and how they’ll evolve ahead.
Insight Provision
BI extracts insights derived by analyzing trends in what occurred across every level of the enterprise to set benchmarks and manage progress toward defined goals. Data analytics meticulously applies scientific methods to pinpoint and quantify the causal drivers underpinning observed results and patterns and forecast what will transpire next.
Expected Actions
BI consolidates accurate data summary of the past primary to assist strategic management, and decision-making and spur necessary corrections to business function. Data analytics equips decision-makers to make proactive moves leveraging empirically backed predictions, anticipating challenges, or seizing opportunities before they arise.
Scope
BI enables a wide, big-picture purview of organization health and performance from the C-Suite level on down across all functional business units with tailored reporting. Data analytics projects often address specific lines of inquiry into emerging risks, changes, untapped potential, etc, with precise quantitative modeling of options.
Similarities Between Data Analytics and Business Intelligence
While business intelligence and data analytics diverge in some key ways, they also share common ground on certain facets. Here’s a rundown of some core parallels:
Data-Driven Guidance
Both BI and data analytics platforms rely heavily on data extraction, aggregation, filtering, statistical evaluation, visualization, and more to shape actionable insights for leadership. They leverage vast data resources to cut through the noise and reveal key patterns and truths to inform planning.
Quantitative Rigor
These disciplines prize exacting, meticulous analysis grounded in robust, measurable information vs gut instincts or guesswork. They entail sifting through complex data flows, connecting disparate dots, and crystallizing findings through an empirical lens.
Tech Foundation
BI and data analytics solutions require leveraging complex information systems architecture – data warehouses, lakes, clouds, etc. along with analytical software, visualization tools, and advanced algorithms at scale to distill meaning.
Continuous Analysis
Rather than ad hoc inquiries, BI and data analytics run on an always-on engine, constantly ingesting real-time data flows across the enterprise to adapt to fluid conditions. New inputs perpetually fine-tune reporting and modify projections as trends bend.
Strategic Impact
Strategic Impact
Both capacities serve as pivotal aids in steering leadership strategizing, planning cycles, performance benchmarks, and more from the C-suite on down. They fuel pivotal moves from managing budgets to expansion decisions and more.
Key Skills Needed for Data Analytics and Business Intelligence Roles
Here is a detailed overview of the key skills needed for data analytics and business intelligence roles:
For Data Analytics
- Strong mathematical and statistical knowledge: You need fluency in statistical concepts like regression, clustering, sampling distributions, etc. to make sense of data. Brush up on probability theory and statistical inference.
- SQL skills: SQL is the lingua franca of data analysis. Learn to retrieve, manipulate, and transform data using SQL queries. Master aggregations, joins, window functions, and other key concepts.
- Python programming: Python is the most popular language for data analysis and machine learning. Learn to load, clean, visualize, and model data using libraries like Pandas, Numpy, Matplotlib, and Scikit-Learn.
- Data wrangling: Real-world data is often messy and inconsistent. You need the skills to identify anomalies, handle missing values, parse unstructured data, normalize values, etc, to clean up datasets.
- Visualization: Being able to visualize and communicate insights from data analysis is crucial. Know how to create plots, charts, and dashboards using tools like Tableau, Power BI, or Python’s Matplotlib.
- Machine learning: ML techniques like regression, clustering, and classification are important for advanced analysis. Have a working knowledge of algorithms like regression, K-means, random forests, and neural networks.
For Business Intelligence
- IT/BI platform expertise: Implement solutions on BI platforms like SAP, SAS, Salesforce, and Oracle. Learn ETL processes to integrate data from diverse sources into data warehouses and marts.
- Data modeling: Design relational databases, dimensional models, and schemas to store data for easy access and analysis. Master techniques like star and snowflake schema, OLAP cubes, etc.
- Advanced SQL: Write complex SQL queries to retrieve aggregated data for reporting. Know window functions, CTEs, and stored procedures. Implement performance optimizations.
- Data storytelling: Learn to turn data into impactful narratives and actionable insights for business leaders. Master data visualization and presentation skills.
- Strategic thinking: Understand how to align analytics to business goals and strategies. Develop analytical maturity to drive data-driven decision-making in organizations.
- Stakeholder management: Manage relationships with diverse stakeholders to understand info needs and drive the adoption of analytics outputs.
- IT/Data Security: Implement robust policies, access controls, and procedures to ensure data privacy, confidentiality, and governance. Stay updated on the latest regulations.
Conclusion
When it comes down to it, data analytics and business intelligence both empower organizations to convert raw information into pivotal insights to outpace competition. Yet they hone in on distinct pieces of the data value chain with business intelligence monitoring rearview performance and data analytics predicting what lies ahead.
By honing in on the unique vantage points and methodologies separating descriptive, diagnostic, predictive, and prescriptive techniques, companies crystallize an information advantage from both hindsight and foresight. While business intelligence delivers trusted data stewardship and governance, data analytics unlocks breaking innovations to uncover hidden levers driving the bottom line.
Rather than an either/or proposition, leading organizations implement an ensemble approach, uniting the best of both disciplines. They tap business intelligence for tracking progress towards KPIs and reliable data integrity while leveraging data analytics to run simulations and quantify how future decisions will resonate. This ethos of learning from the past and predicting the future sits at the heart of digital transformation.
For those looking to skill up and spearhead data strategies at their enterprise, CCS Learning Academy offers cutting-edge courses in both Business Intelligence and Data Analytics. Taught by industry veterans, the curriculums take a hands-on approach, diving into actual tools and use case applications to equip learners to deliver ROI from their first project. Don’t forget to check out our immersive 12-week Data Analytics & Engineering bootcamp training program to fast-forward your career in data analytics and business intelligence!
FAQs
Q1: What is the main difference between Data Analytics and Business Intelligence?
Answer: The main difference lies in their primary focus and approach. Business Intelligence (BI) is about using data to generate actionable insights for current business operations, primarily through reporting and visualization. Data Analytics involves a deeper analysis, often predictive or prescriptive, to uncover trends and patterns for future decision-making.
Q2: How does the purpose of Data Analytics differ from Business Intelligence?
Answer: Data Analytics is typically used for discovering deeper insights, predicting future trends, and making strategic decisions. Business Intelligence, on the other hand, is more focused on providing a clear view of the current state of the business through data aggregation, reporting, and analysis.
Q3: What tools are commonly used in Business Intelligence?
Answer: Common tools in Business Intelligence include Tableau, Microsoft Power BI, SAP BusinessObjects, and Oracle BI. These tools are used for data visualization, dashboards, and reporting to help businesses understand their current performance.
Q4: What types of tools are used in Data Analytics?
Answer: Data Analytics often involves tools like Python, R, SQL, and specialized software for statistical analysis and predictive modeling, such as SAS, SPSS, or advanced features of Excel.
Q5: Can Business Intelligence and Data Analytics be used together?
Answer: Yes, Business Intelligence and Data Analytics can be used together effectively. BI can help businesses understand their current state and performance, while Data Analytics can provide deeper insights and predictions to inform future strategies.
Q6: What skills are required for a career in Business Intelligence?
Answer: A career in Business Intelligence typically requires skills in data visualization, an understanding of BI tools like Tableau or Power BI, SQL for data manipulation, and a strong grasp of business processes and decision-making.
Q7: What skills are necessary for Data Analytics?
Answer: Data Analytics requires skills in statistical analysis, proficiency in programming languages like Python or R, experience with data mining and predictive modeling techniques, and often a strong mathematical background.
Q8: Is Business Intelligence more about descriptive analytics?
Answer: Yes, Business Intelligence is primarily focused on descriptive analytics, which involves describing, summarizing, and understanding historical data to inform current business decisions.
Q9: Does Data Analytics involve more predictive and prescriptive analysis?
Answer: Yes, Data Analytics often involves predictive analysis, which forecasts future trends, and prescriptive analysis, which suggests actions to achieve desired outcomes based on data.
Q10: What is the role of a Business Intelligence Analyst?
Answer: A Business Intelligence Analyst focuses on analyzing data to provide actionable insights into the business’s current operations. They create reports and dashboards and help in making informed business decisions based on data.
Q11: What is the role of a Data Analyst?
Answer: A Data Analyst examines large data sets to identify trends, develop charts, and create visual presentations to help businesses make more strategic decisions. They often delve into predictive and prescriptive analytics.
Q12: How do the goals of Business Intelligence and Data Analytics align with business strategy?
Answer: Business Intelligence aligns with short-term business strategy by providing clear insights into current operations, while Data Analytics aligns with long-term strategy by offering deeper insights and forecasts that guide future business planning and development.


