
The decision between Power BI vs. QlikView might be crucial for businesses looking to leverage data in the dynamic field of business intelligence. Each of the two well-known platforms in the analytics space has advantages and characteristics.
Let’s explore the main distinctions between QlikView and Power BI, highlighting their respective features, functionality, and performance standards. Knowing these differences is essential for anyone working in IT, corporate leadership, or data enthusiasts to make judgments that meet their unique analytical requirements.
- Why is There a Need for Business Intelligence Tools?
- Power BI vs QlikView – An Overview
- What is Power BI?
- What is QlikView?
- Who Uses Power BI?
- Who Uses QlikView?
- Power BI vs QlikView – Key Differences [Comparison Table]
- Benefits of Power BI
- Benefits of QlikView
- Features of Power BI
- Features of QlikView
- Head-to-Head Comparison of Power BI and QlikView
- How to Choose Between Power BI and QlikView
- Final Thoughts
- FAQs
Why is There a Need for Business Intelligence Tools?
70% of the companies feel data visualization can help them simplify patterns, trends, and other information while making business decisions. Although many BI tools offer this option, Power BI and QlikView are often considered the top players. Both these tools provide exceptional features, but deciding which is the best becomes difficult.
Power BI vs QlikView – An Overview
Power BI was developed under the name Project Crescent in 2010 by Microsoft, and its first version was released in 2011. However, it was renamed to Power BI and made available to the public in 2015 and is one of the leading BI tools today.
Similarly, QlikView was named QuickView in 1994 but was later renamed in 1996. It was initially created to gather in-depth analysis from multiple sources. It was later converted into BI software and is one of the top-rated ones.
What is Power BI?
Power BI from Microsoft offers business analytical services to its clients. It provides business intelligence capabilities and interactive visualizations to help you create dashboards and reports using its simple and easy-to-use user interface. Additionally, it is easy to connect with multiple data sources, create custom calculations, transform data, and visualize it through graphs, tables, and charts.
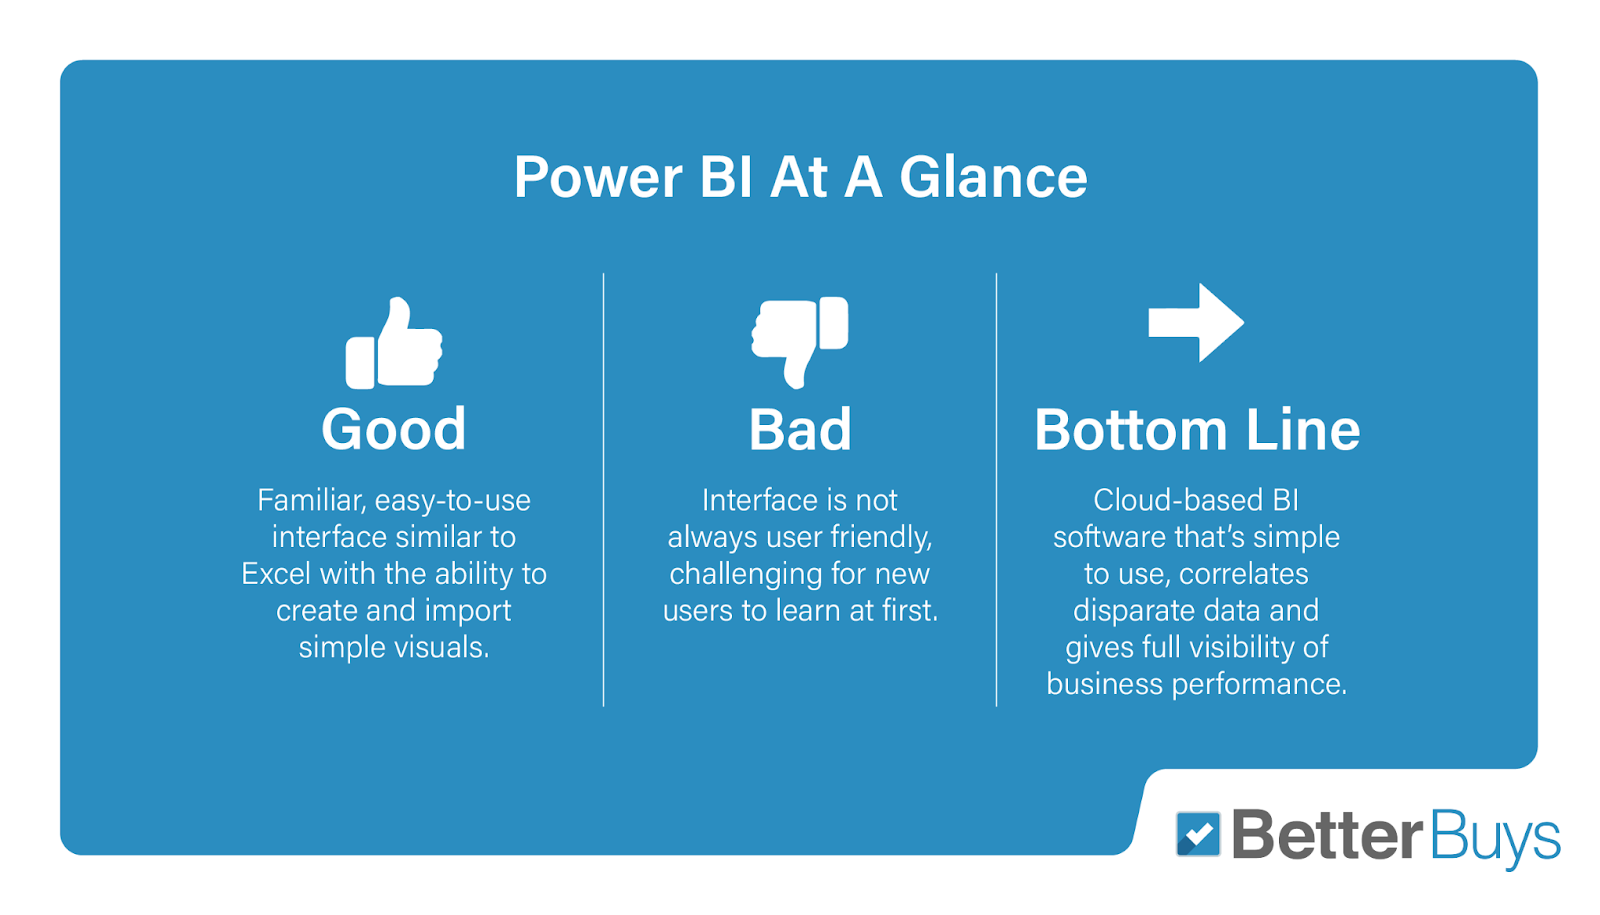
A desktop program, web browser, or mobile device can access it. It is also integrated with other Microsoft tools like SharePoint and Excel. You can make strong data-driven decisions and gain insights into your performance using its excellent analysis capabilities and data modeling skills.
What is QlikView?
Like Power BI, QlikView is also a BI platform offering numerous data visualization options, such as graphs, charts, tables, maps, dashboards, and gauges. It uses an in-memory feature to help you quickly and easily load and manipulate data from different sources. Associative analysis is a special feature of QlikView that shows the connections and patterns among data pieces in various dimensions and filters.
It can handle large datasets comfortably from different sources and instantly access, analyze, and capture the data without any programming or modeling. You can always view and analyze data in your preferred dashboards.
Who Uses Power BI?
This BI tool is accepted and used across numerous industries, such as retail, energy, healthcare, media, and manufacturing. It is also commonly used in transportation, IT companies, finance, life sciences, and resource management. Business users, developers, and analysts use this BI tool to track the progress of their projects.
Who Uses QlikView?
It is generally used in IT and services, finance, insurance, education, social media, and helpdesk management. Most companies with over 1000 employees prefer to go with this BI tool. It helps analysts, business users, and data scientists with data-driven decisions using AI-generated insights, AutoML predictions, and natural language interactions. For data scientists, it particularly supports expanding models and creating interactive predictive calculations.
Power BI vs QlikView – Key Differences [Comparison Table]
Let’s look at some key differences between Power BI and QlikView.
| Parameters | Power BI | QlikView |
| Developer | Microsoft | Qlik |
| Latest Version | November 2022 – Power BI Desktop | November 2021 – QlikView |
| Ease of Operating | It is like an advanced version of Excel. | You need to learn programming skills to operate it. |
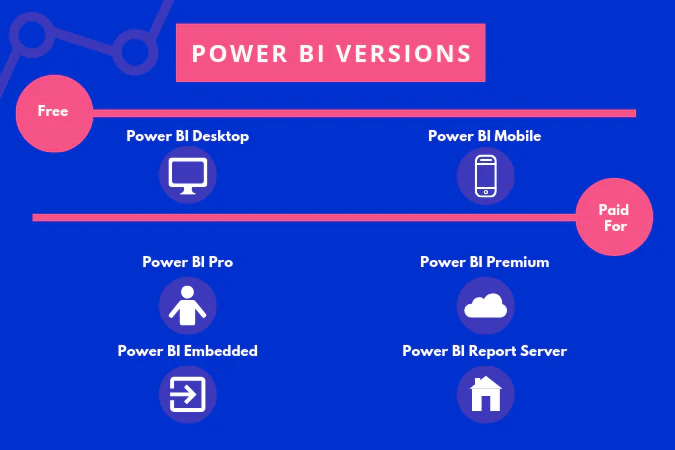
| Cost Effectiveness | You can start with the free version and later upgrade to paid versions, like Pro and Premium. | This platform is expensive, and even the process of getting the software is complicated. |
| Customer Base | Excel users prefer to use this platform. | IT and tech companies often use it. |
| Integration with Other Tools | It easily integrates with Microsoft tools, such as SQL Server, Excel, Dynamic NAV, etc.. | It depends on external APIs, which can have limitations. |
| Data Sources | Allows extensive access to all kinds of data, whether on-premises or on cloud. | Besides the comprehensive access to data, QlikView also needs prior downloading and installation of the connectors before being able to use them. |
| Complexities | This platform is very user-friendly. | It is a very complex platform. Hence, it is great for programmers and data scientists majorly, but others may find it difficult. |
| Availability | This platform is available on the cloud and is a cloud-based solution, and data can be accessed from anywhere with just the availability of the internet. | It is an on-premise solution, and you will need to be physically present in the office to access the data. The platform also offers a cloud-based option for remote workers. |
| Data Visualization | It includes interactive reports, embedded visuals, and scalable dashboards. Its interactive panels contain titles displaying separate data, which is linked for analysis and comparison to a dataset. The reports are created from the ground up, containing only the most essential details to prevent users from becoming overwhelmed or perplexed. | It uses color-coded customization. The irrelevant data is colored gray instead of removed. Thus, it saves time and helps in re-examining the data to find anything valuable. However, its filtering system is complex, making it difficult for non-tech-savvy persons to create visualizations. |
| Data Analysis | It is known to be an agile and more accessible tool. However, it struggles to handle large datasets. Hence, it is not considered a good option for complex dataset handling. | It is known to handle large datasets and can perform calculations much faster. It is also better in visualization performance needed for decision-making. |
| Customization | Offers different kinds of customization options. | It also offers good customization and flexibility to its users. |
| Performance | It generally performs well, however, depending on the hardware and the data set size. | It is known to offer excellent performance for complex and large datasets. |
Benefits of Power BI
Listed below are some of the benefits offered by Power BI:
- It can easily integrate with the different Microsoft products.
- People using Office 365 and SQL servers will have good data sources already available for their use.
- It is as simple as entering data in Excel and getting visualized data in Power BI.
- It is also compatible with cloud-based computing, thus making real-time analysis easier.
- It can maintain data for the whole company, irrespective of the department, which can increase production.
- It is user-friendly, and with a few clicks, you can get every detail.
- You do not need any special training to operate this platform.
- In-memory evaluation technology with DAX scripting offers simplicity, efficiency, and stability.
- It is an excellent choice for people doing remote work as it can help access data from anywhere.
- It is reliable and supported by Microsoft.
- It makes the process of reorganizing employer statistics into improved graphics easier.
- It also enables the data to be readily integrated with cloud services like Cortana or the Bot framework.
Benefits of QlikView
Let’s look at the benefits offered by QlikView:
- It is amongst the most robust and mature BI tools.
- It is primarily built for analytical purposes, and people with data science or programming backgrounds can significantly benefit from it. If you are looking to explore this software and become an expert in data science, you can enroll in the data science bootcamp by CCSLA.
- If you require low-level access, QlikView’s scripting system lets you dive right into the system and play around with any models you develop.
- It is also great for creating different kinds of visualizations and presentations.
- This platform excels in its raw speed. Its in-memory analytics capabilities enable anyone with adequate processing power to analyze large amounts of data and draw conclusions quickly.
- It has significant applications and dashboards to help in data interpretation effectively.
- It also supports teams working together to make crucial business decisions.
- It allows you to work proficiently without needing any support.
- It is straightforward to install and even low maintenance.
- Offers strict security provisions to ensure the data is safe.
Features of Power BI
Here are some features offered by Power BI:
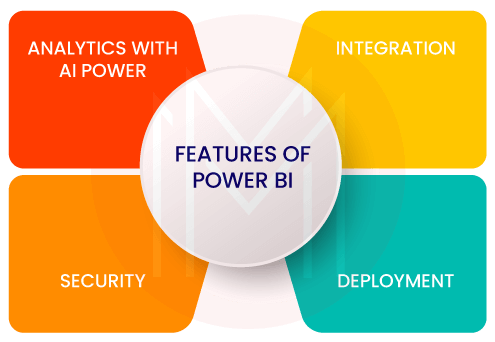
- AI-enabled analytics
- Easy deployment
- Smooth integration
- Enhanced security
Features of QlikView
Listed below are the features of QlikView:
- Accessible analytical engine
- QIX processing engine
- Enhanced analytics
- Sturdy framework
- In-memory data storage
- Guidance advisor
Head-to-Head Comparison of Power BI and QlikView
Let’s consider comparing Power BI and QlikView on the topmost essential things that can help you make a better decision.
| Parameters | Power BI | QlikView |
| Data load transformation | Very good | Excellent |
| Measures | Very good | Excellent |
| Searching | Adequate | Excellent |
| Page layout | Very good | Very good |
| Free Demo | Yes | Yes |
| Paid for the cloud version | Yes | Yes |
| Adjusting different screen sizes | Good | Excellent |
| Data load time | Bit slow | Very fast |
| Null handling | Good | Difficult |
| Set-up time | Quick | Quick |
| Basic Version | Free | Free with limited features |
| Advanced version | Pro – $10 | Business $30 |
| Free Trial | Pro – 60 days | Business – 30 days |
| Ease of learning | Yes | No |
| UI | Easy to use | Decent |
| Native Mobile App | Android and Mac | Mac |
| Natural Language Processing | Yes | No |
| Reporting | Yes | Yes |
How to Choose Between Power BI and QlikView
Choosing between Power BI and QlikView can be a tough decision as both platforms offer some incredible features that make them better than their counterpart. However, the decision to go with either Power BI or QlikView should be made based on specific needs and requirements while keeping the end user in mind.
For instance, if the company has a lot of Microsoft products and does not need any advanced data modeling, it should opt for Power BI. On the other hand, QlikView is the better option for data-focused users who wish to create beautiful screenshots or in-depth, complicated studies without limitations.
Here are some things to consider before finalizing any particular software:
- Identify the problem or the reason which you wish to solve.
- Identify who will be using the BI tool.
- Finalize your data transformation needs.
- Ensure that the tool works with all data locations.
This decision can also be made based on the size of your organization. For instance:
- Startups and small businesses – Since Power BI is more affordable, it will be an excellent choice for this industry size. Although QlikView can offer superior service, it can be expensive and complicated.
- Medium-sized – As the company’s size increases, the demand for data-driven decisions will also increase. Hence, QlikView is the right choice for complicated analysis. This does not mean that Power BI will not be suitable; you can opt for the free version, see if it works for your requirements, and then go for the paid packages.
- Enterprise-level – If you are a large, significant enterprise, you will want to go for QlikView for its features and functionalities. It can offer a lot more options than Power BI. This is because large enterprises have vast and complicated data to work around and will need a tool to support the same.
Final Thoughts
In conclusion, the decision between QlikView and Power BI ultimately comes down to the needs and preferences of a particular organization. For individuals who have a significant investment in the Microsoft ecosystem, Power BI is an excellent option due to its extensive visualization capabilities, user-friendly design, and easy connection with Microsoft applications.
However, QlikView is distinguished by its associative data model, which offers a unique method for finding and analyzing data. QlikView can be desirable for organizations seeking a more flexible and associative data exploration experience. To optimize their data-driven insights, businesses should carefully assess their objectives and goals before selecting a tool, as each has pros and limitations.
If you want to know more about these tools, check them out on CCSLA. Moreover, you can also enroll in data analytics courses to help you become proficient in using these tools.


