
The world of data is expanding at a mind-boggling rate. As of 2024, a staggering 120 zettabytes of data has been created globally, with no signs of slowing down – this figure is projected to balloon to 181 zettabytes by 2025. Over 57% of this data deluge is being churned out by internet users across the world.
With data growing exponentially, the field of data analytics is scrambling to keep up. Valued at $276.55 billion in 2021, the big data analytics market is predicted to blast off to $349.56 billion in 2024.
Businesses are clamoring for data analytics talent more than ever before. As a professional looking to break into this high-growth space or pivot into a data-centric role, you can expect interview questions that dig deep into your technical knowledge, problem-solving skills, and ability to translate numbers into impactful insights. This makes preparation key.
In this article, we lift the lid on 30 of the most common and critical data analytics interview questions you could face in 2024. From classics on statistics and SQL to scenario-based questions evaluating your data storytelling ability – you’ll find out what to expect and how to nail your responses.
Let’s get ready to geek out on the fascinating field of data analytics! This roundup promises to equip you with insider knowledge to tackle any data-related question thrown your way. Time to bring your A-game and land that dream analytics job in 2024!
- Top 30 Data Analytics Interview Questions and Answers
- 1. What sets apart Data Analysis from Data Mining?
- 2. What does Data Validation entail?
- 3. What does Data Analysis broadly encompass?
- 4. How to assess if a data model is faring well or falling short?
- 5. Break down data cleaning.
- 6. Shed light on Outlier.
- 7. What are the ways to sniff out outliers? Break down the different ways to iron out issues arising from it.
- 8. Shed light on the KNN imputation method.
- 9. Break down Normal Distribution.
- 10. What does data visualization involve?
- 11. How does data visualization prop up?
- 12. Call out some of the Python libraries leveraged in data analysis.
- 13. Break down a hash table.
- 14. What do collisions in a hash table denote? Break down the ways to steer clear of it.
- 15. Pen down the characteristics of a good data model.
- 16. List down the disadvantages of Data analysis.
- 17. Shed light on Collaborative Filtering.
- 18. What does Time Series Analysis encompass? Where is it brought into play?
- 19. What do clustering algorithms encompass? Pen down different properties of clustering algorithms.
- 20. What is a Pivot table? Lay out its usage.
- 21. What do univariate, bivariate, and multivariate analysis involve?
- 22. Name some widely used tools leveraged in big data.
- 23. Break down Hierarchical clustering.
- 24. What is included in logistic regression analysis?
- 25. What are the key elements of the K-means algorithm?
- 26. What is the difference between the concepts of recall and the true positive rate?
- 27. What are the ideal situations in which a t-test or z-test can be brought into play?
- 28. Why is Naive Bayes referred to as ‘naive’?
- 29. What is the simple difference between standardized and unstandardized coefficients?
- 30. How are outliers sniffed out?
- How to Prepare for a Data Analyst Interview
- Conclusion
Top 30 Data Analytics Interview Questions and Answers
Data analytics is one of the hottest domains, with businesses relying heavily on data-driven insights to steer strategy and decisions. Mastering the interview game is key to landing that coveted data analyst job.
This exclusive roundup of 30 questions arms you with insider knowledge of what recruiters have on tap to assess your technical expertise, statistical skills, and problem-solving abilities in 2024 interviews.
1. What sets apart Data Analysis from Data Mining?
Data analysis digs into cleaning, organizing, and leveraging data to churn out meaningful insights. Data mining zones in on searching for hidden patterns within the data sets.
Data analysis throws up results that are far more digestible and relatable to wider audiences than the outputs from data mining.
2. What does Data Validation entail?
Data validation, as the name gives away, is the process that taps into assessing the precision of data and the robustness of the source, too. There are many protocols in data validation, but the crux ones are data screening and data verification.
Data screening: Making use of various models to ensure the data checks out accurately without any redundancies slipping through.
Data verification: If any redundancy crops up, it is sized up basis of multiple steps, and then a call is taken to stamp the presence of the data item.
3. What does Data Analysis broadly encompass?
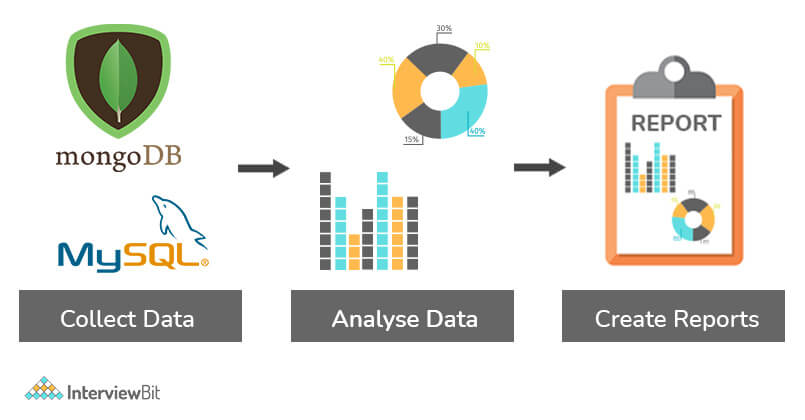
Data analysis is the structured procedure that ropes in working with data by pulling off activities such as ingestion, cleaning up, transforming, and appraising it to draw out insights, which can feed into cranking up revenue.
Data is amassed, to kick things off, from multiple sources. Since the data is a raw entity, it needs to be cleaned up and processed to fill out any missing values and to peel off any entity that lies outside the scope of usage.
Post pre-processing the data, it can be parsed through models, which leverage the data to perform some analysis on it.
The last step ropes in reporting and ensuring that the data output is molded into a format that also provides for a non-technical audience, aside from analysts.
4. How to assess if a data model is faring well or falling short?
This question is subjective, but certain straightforward assessment guideposts can be leaned on to take stock of the accuracy of a data model. They are as follows:
A well-designed model should dish out good predictability. This ties into the nimbleness to be easily able to foresee future insights as and when needed.
A well-rounded model fits in seamlessly with any change made to the data or the pipeline if required.
The model should have the capacity to stay on top in case there is an urgent requirement to scale up the data.
The model’s functioning should sail smoothly and it should be easily grasped among clients to assist them in extracting the requisite results.
5. Break down data cleaning.
Data cleaning, also referred to as data cleansing or data scrubbing, or wrangling, basically entails a process of pinpointing and then tweaking, swapping out, or removing the inaccurate, incomplete, imprecise, irrelevant, or missing bits and pieces of the data as the need pops up. This fundamental building block of data science ensures data is on point, consistent, and readily usable.
6. Shed light on Outlier.
In a dataset, Outliers are values that stand out significantly from the mean of characteristic attributes of a dataset. With the aid of an outlier, we can take stock of either variability in the measurement or an experimental error slipping in. There are two kinds of outliers i.e., Univariate and Multivariate. The graph shown below indicates there are four outliers in the dataset.
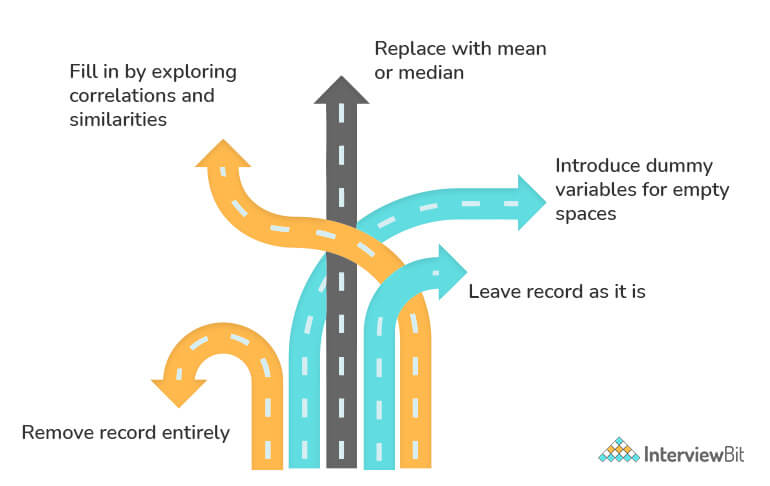
7. What are the ways to sniff out outliers? Break down the different ways to iron out issues arising from it.
Outliers are sniffed out based on two methods:
Box Plot Method: As per this method, the value is earmarked as an outlier if it overshoots or undershoots 1.5*IQR (interquartile range), that is, if it figures above the top quartile (Q3) or below the bottom quartile (Q1).
Standard Deviation Method: As per this method, an outlier is characterized as a value that is greater or lower than the mean ± (3*standard deviation).
8. Shed light on the KNN imputation method.
A KNN (K-nearest neighbor) model is usually seen as one of the most widely used techniques for imputation. It enables a point in multidimensional space to be paired up with its closest k neighbors. By leveraging the distance function, two attribute values are held up against each other. Leveraging this approach, the closest attribute values to the missing values are roped in to fill in these missing values.
9. Break down Normal Distribution.
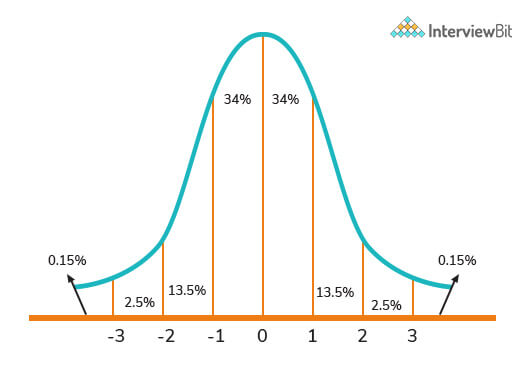
Known as the bell curve or the Gauss distribution, the Normal Distribution plays a stellar role in statistics and makes up the bedrock of Machine Learning. It usually defines and quantifies how the values of a variable differ in their means and standard deviations, that is, how their values are scattered.
The above image portrays how data usually tends to be clustered around a central value with no leaning on either side. In addition, the random variables are distributed basis symmetrical bell-shaped curves.
10. What does data visualization involve?
The term data visualization denotes a graphical representation of information and data. Data visualization tools equip users to easily view and grasp trends, outliers, and patterns in data by way of visual elements like charts, graphs, and maps. Data can be viewed and parsed in a smarter way, and it can be transformed into diagrams and charts by leaning on this technology.
11. How does data visualization prop up?
Data visualization has quickly gained traction owing to its ease of viewing and decoding complex data in the form of charts and graphs. Aside from serving up data in a format that is easier to grasp, it brings to light trends and outliers. The best visualizations shine a light on meaningful information while filtering out noise from data.
12. Call out some of the Python libraries leveraged in data analysis.
Several Python libraries that can be brought to bear on data analysis include:
- NumPy
- Bokeh
- Matplotlib
- Pandas
- SciPy
- SciKit, etc.
13. Break down a hash table.
Hash tables are usually characterized as data structures that store data in an associative manner. In this, data is generally stashed away in array format, which provides for each data value to have a unique index value. Leveraging the hash technique, a hash table churns out an index into an array of slots from which we can dig up the desired value.
14. What do collisions in a hash table denote? Break down the ways to steer clear of it.
Hash table collisions are typically triggered when two keys have the same index. Collisions, thus, culminate in a problem because two elements cannot share the same slot in an array. The following methods can be brought to bear to sidestep such hash collisions:
Separate chaining technique: This method ropes in stowing away numerous items, hashing to a common slot by way of the data structure.
Open addressing technique: This technique zones in on unfilled slots and tucks the item into the first unfilled slot it comes across.
15. Pen down the characteristics of a good data model.
An effective data model must possess the following characteristics in order to be stamped as good and fleshed out:
- Dishes out predictability performance so the outcomes can be assessed as accurately as possible or almost as precisely as possible.
- As business demands change, it should be adaptable and agile to fit in those changes as necessitated.
- The model should scale in proportion to the change in data.
- Clients/customers should be able to reap tangible and profitable benefits from it.
16. List down the disadvantages of Data analysis.
The following are some disadvantages of data analysis:
- Data Analytics may compromise customer privacy and culminate in deals, purchases, and subscriptions being put at risk.
- Tools can be complex and necessitate prior training.
- Opting for the right analytics tool each time necessitates a lot of skills and know-how.
- Information obtained through data analytics can be misused to target individuals based on their political beliefs or ethnicities.
17. Shed light on Collaborative Filtering.
Anchored in user behavioral data, collaborative filtering (CF) whips up a recommendation system. By parsing data from other users and their interactions with the system, it filters out information. This method assumes that people who chime in in their evaluation of particular items will likely see eye to eye again down the line. Collaborative filtering has three major components: users- items- interests.
Example:
Collaborative filtering can be spotted, for instance, on online shopping sites when you catch sight of phrases such as “recommended for you”.
18. What does Time Series Analysis encompass? Where is it brought into play?
In the sphere of Time Series Analysis (TSA), a sequence of data points is parsed over an interval of time. Instead of just logging the data points intermittently or randomly, analysts put down data points at regular intervals over a period of time in the TSA. It can be pulled off in two different ways: in the frequency and time domains. As TSA has a wide scope of application, it can be roped in in a variety of fields. TSA plays a vital role in the following areas:
- Statistics
- Signal processing
- Econometrics
- Weather forecasting
- Earthquake prediction
- Astronomy
- Applied science
19. What do clustering algorithms encompass? Pen down different properties of clustering algorithms.
Clustering is the process of sorting data into groups and clusters. In a dataset, it pinpoints similar data groups. It is the technique of banding together a set of objects so that the objects within the same cluster are akin to one another rather than to those found in other clusters. When set in motion, the clustering algorithm bears the following properties:
- Flat or hierarchical
- Hard or Soft
- Iterative
- Disjunctive
20. What is a Pivot table? Lay out its usage.
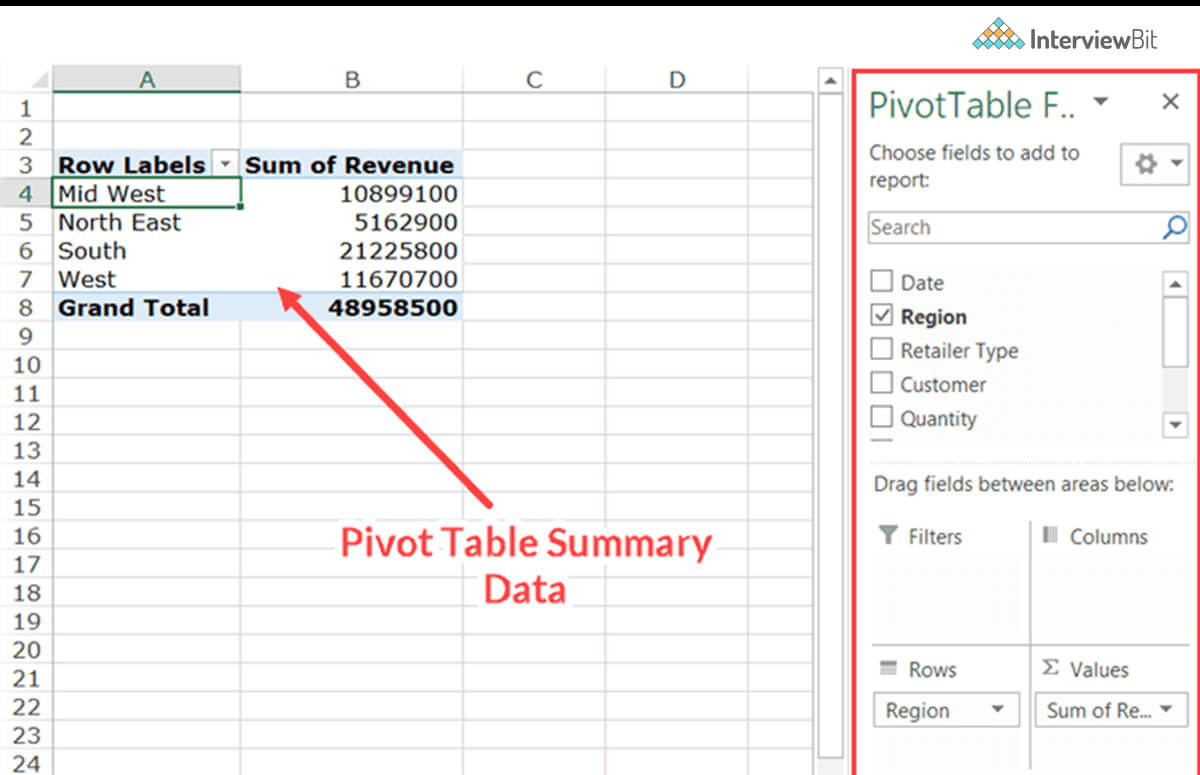
One of the fundamental tools for data analysis is the Pivot Table. With this feature, you can quickly summarize large datasets in Microsoft Excel. Using it, we can flip columns into rows and rows into columns. Furthermore, it enables grouping by any field (column) and administering advanced calculations on them. It is an extremely easy-to-leverage program since you just haul and plonk rows/columns headers to whip up a report. Pivot tables consist of four different sections:
- Value Area: This is where values are documented.
- Row Area: The row areas are the headings to the left of the values.
- Column Area: The headings atop the values area add up to the column area.
- Filter Area: Using this filter, you may drill down in the data set.
21. What do univariate, bivariate, and multivariate analysis involve?
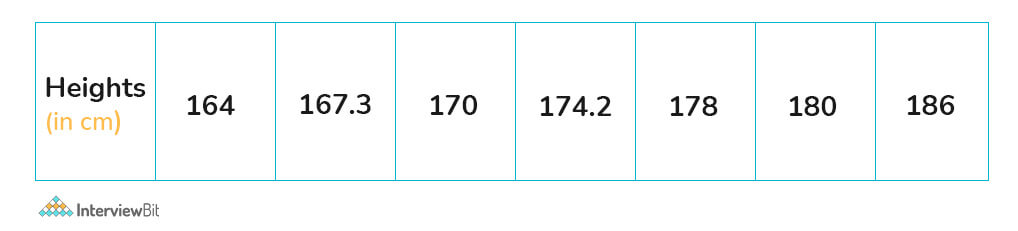
Univariate Analysis: The word uni means only one, and variate means variable, so a univariate analysis has only one dependable variable. Univariate Analysis involves the examination of a single dependable variable, making it the most straightforward among the three analyses. In this method, only one variable is considered, such as height, in a given dataset.
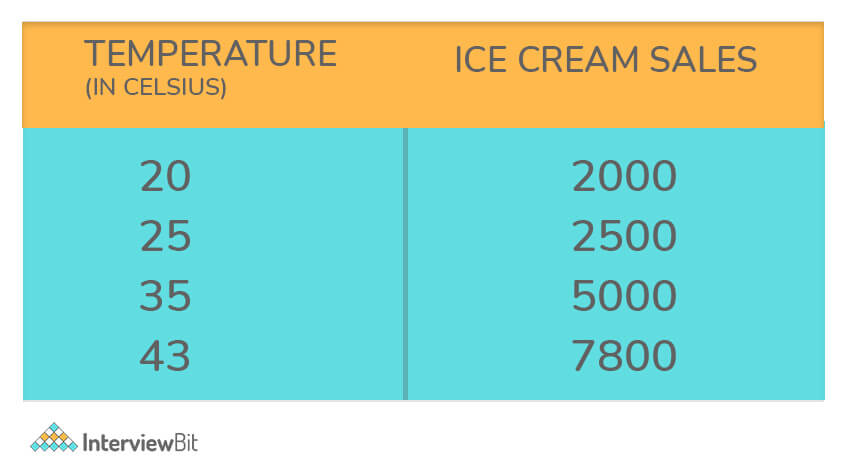
Bivariate Analysis: Bivariate Analysis, on the other hand, deals with two variables. The prefix “bi” signifies the involvement of two variates. This analysis explores the causes of these two variables and the relationships between them. An example could be the study of temperature and ice cream sales during the summer season.
Multivariate Analysis: Multivariate Analysis becomes essential when the analysis involves more than two variables simultaneously. Similar to bivariate analysis, it examines the relationships between variables, but in this case, there are more than two variables under consideration.
22. Name some widely used tools leveraged in big data.
In order to handle Big Data, multiple tools are brought into play. There are a few popular ones, as follows:
- Hadoop
- Spark
- Scala
- Hive
- Flume
- Mahout, etc.
23. Break down Hierarchical clustering.
This algorithm sorts objects into clusters anchored on similarities, and it is also referred to as hierarchical cluster analysis. When hierarchical clustering is pulled off, we land up with a set of clusters that stand apart from each other.
This clustering technique can be split into two types:
- Agglomerative Clustering (which employs a bottom-up strategy to break up clusters)
- Divisive Clustering (which leans on a top-down strategy to break up clusters)
24. What is included in logistic regression analysis?
Logistic Regression is basically a mathematical model that can be leaned on to study datasets with one or more independent variables that decide a particular outcome. By looking into the relationship between multiple independent variables, the model predicts a dependent data variable.
25. What are the key elements of the K-means algorithm?
K-means algorithm sorts data into different sets based on how close the data points bunch together. The number of clusters is ticked off by ‘k’ in the k-means algorithm. It tries to uphold a good amount of detachment between each of the clusters.
However, since it operates in an unsupervised nature, the clusters will not have any sort of labels to lean on.
26. What is the difference between the concepts of recall and the true positive rate?
Recall and the true positive rate, both are absolutely identical. Here’s the formula for it:
Recall = (True positive)/(True positive + False negative)
27. What are the ideal situations in which a t-test or z-test can be brought into play?
It is a standard practice that a t-test is used when there is a sample size less than 30 and the z-test is mulled over when the sample size tops 30 in most cases.
28. Why is Naive Bayes referred to as ‘naive’?
Naive Bayes is dubbed naive because it makes the broad assumption that all the data present are unequivocally important and independent of each other. This does not hold water and won’t stand up in a real-world scenario.
29. What is the simple difference between standardized and unstandardized coefficients?
In the case of standardized coefficients, they are decoded based on their standard deviation values. The unstandardized coefficient is gauged based on the actual value present in the dataset.
30. How are outliers sniffed out?
Multiple methodologies can be brought into play for detecting outliers, but the two most commonly used methods are as follows:
- Standard deviation method: Here, the value is seen as an outlier if the value is lower or higher than three standard deviations from the mean value.
- Box plot method: Here, a value is deemed an outlier if it is lesser or higher than 1.5 times the interquartile range (IQR)
How to Prepare for a Data Analyst Interview
Gearing up for a data analyst interview necessitates getting hands-on across a spread of must-have abilities that recruiters zero in on. If you fall short on packing these skills, no employer will extend a callback regardless of where you toss your hat into the ring.
- Cracking the coding test is non-negotiable. You need to flaunt programming and coding prowess working with languages like Python, R, etc. Brush up on the syntax, practice brainteasers, and algorithms, and work on open-source datasets to break into the groove.
- SQL expertise is indispensable. Bone up the basics, like knowing your way around complex queries, aggregations, manipulations, and joins. Test your mettle working with large databases to showcase you can hold your own when data loads pile up.
- A solid grip on Tableau is pivotal, too. Companies want to take stock if you can parse, visualize, and glean insights from substantial datasets leveraging Tableau’s functionalities like charts, dashboards, stories, etc. Get hands-on with distributed computing to prove you can deftly handle data at scale.
- Recruiters look to gauge if you are at one with Excel. From PivotTables, Lookup functions to What-If Analysis – leave no stone unturned. Import sizeable datasets into Excel and fiddle around with formulas, modeling, and forecasting to flaunt analytical rigor.
- Brush up hard on statistical concepts, methodologies, and software packages. Be well-versed with confidence intervals, hypothesis testing, and regression models – the works! Rope in tools like SAS, SPSS, and Stata, among others, to reinforce analytical skills.
In a nutshell, anticipate a grilling session on both the theoretical and practical front. Leave no room for doubt about your coding expertise, analytics chops, data modeling competence, and ability to translate data insights into impactful decisions. Rigorous, well-rounded preparation promises to stand you in good stead!
Conclusion
This round-up of 30 interview questions cracks open what recruiters have on tap to assess analytical rigor and technical know-how in 2024. We have equipped you to get hands-on with the data tasks, terminologies, tools, and metrics that promise to be the mainstay.
So, gear up to flaunt your data wrangling, modeling, and storytelling skills. You can fast forward your career with our job-oriented Data Analytics & Engineering Bootcamp which acts as a launch pad to turn you into an in-demand data analytics professional. The curriculum ties together theory, case studies, and capstone projects, while acclaimed faculty helps you hit the ground running. So waste no time – skill up with the pros and score that dream analytics role!


